L2 Data Interactives
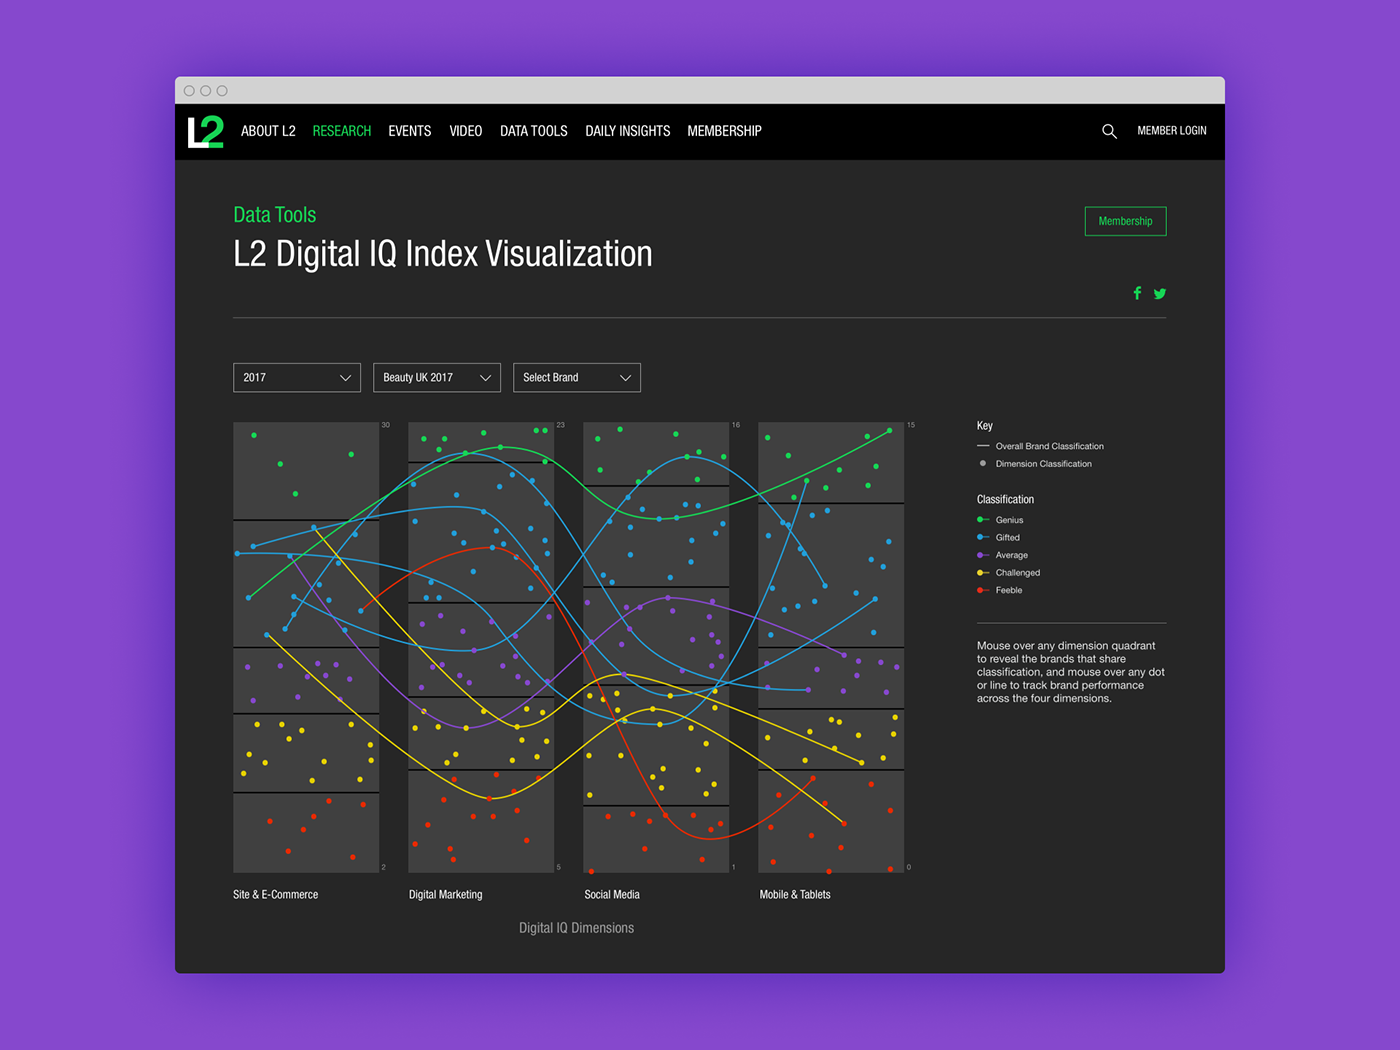
L2 data was traditionally limited to static graphs in research reports, restricting their scope and usefulness to users. By delivering data interactivity digitally, L2 gives brands a richer look into their data and how it relates to competitors and trends over time. These various tools focus on big-picture and niche topics alike, using a singular visual framework that familiarizes users and makes for an intuitive experience.
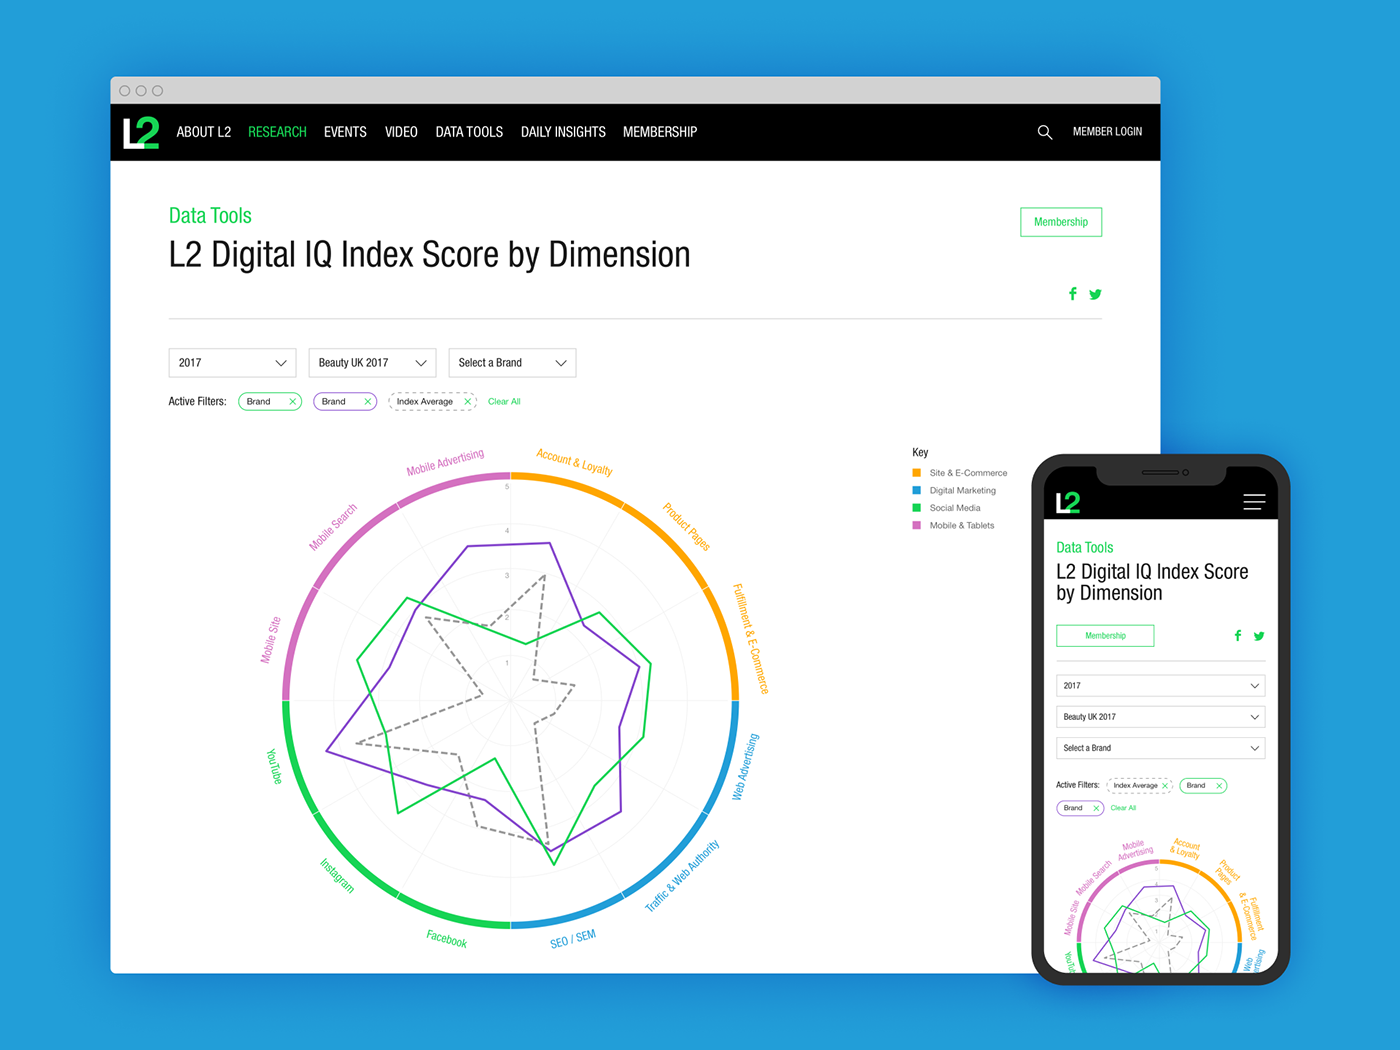


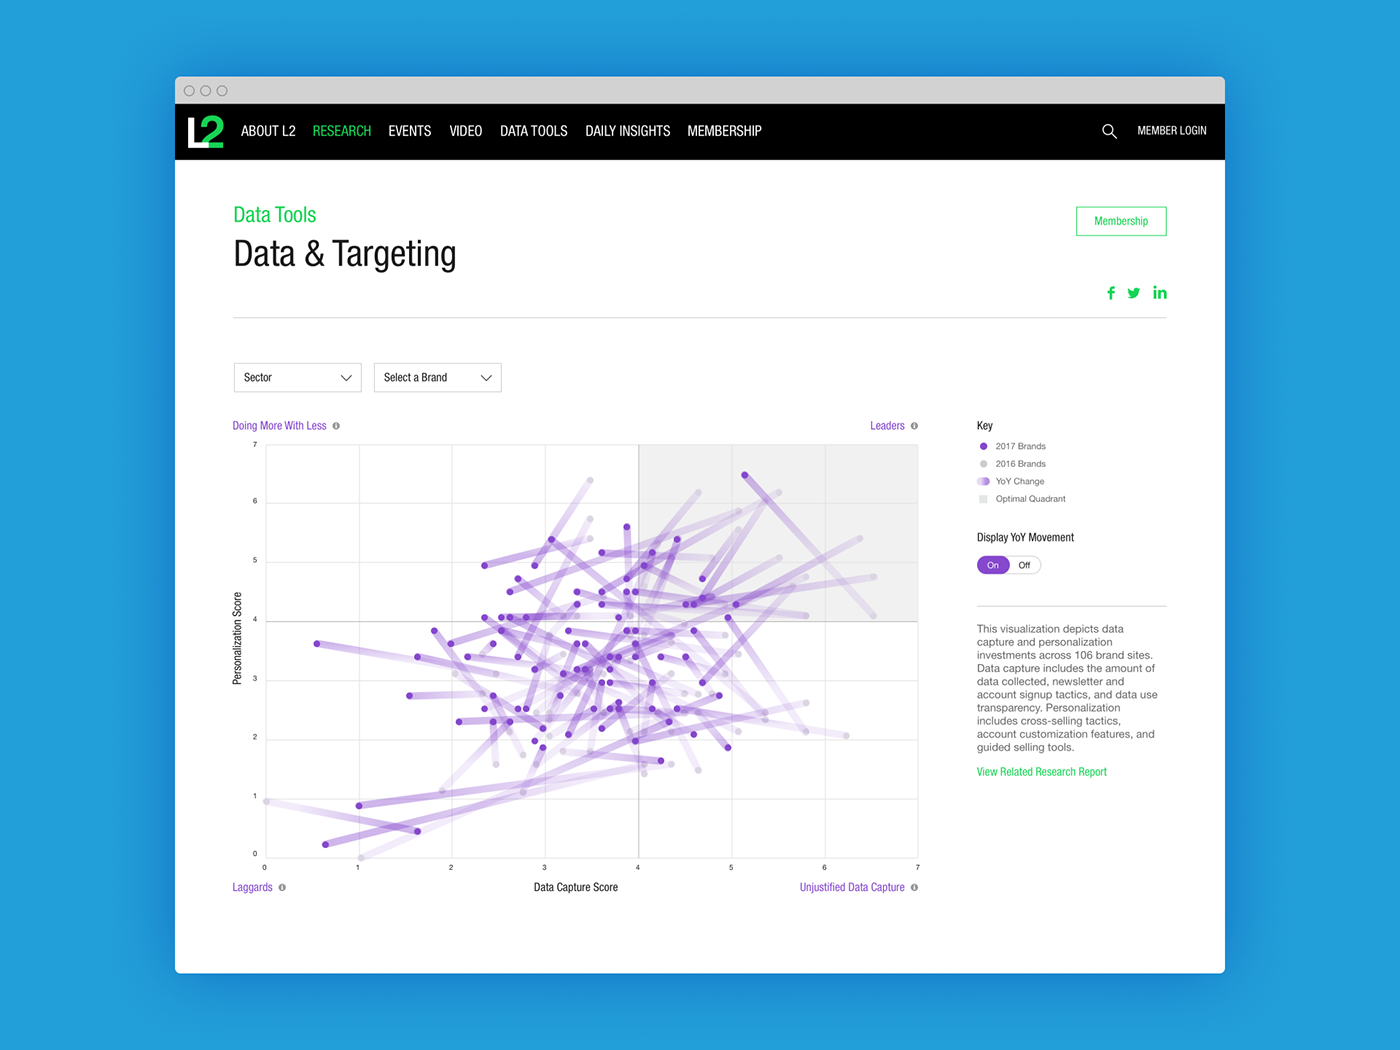


The simple and straightforward aesthetic is a product of centering the design on data legibility, allowing the interface to serve only in improving clarity and ease of use. Each data tool was made in partnership with research and data teams, ensuring data accuracy and that user goals were met.


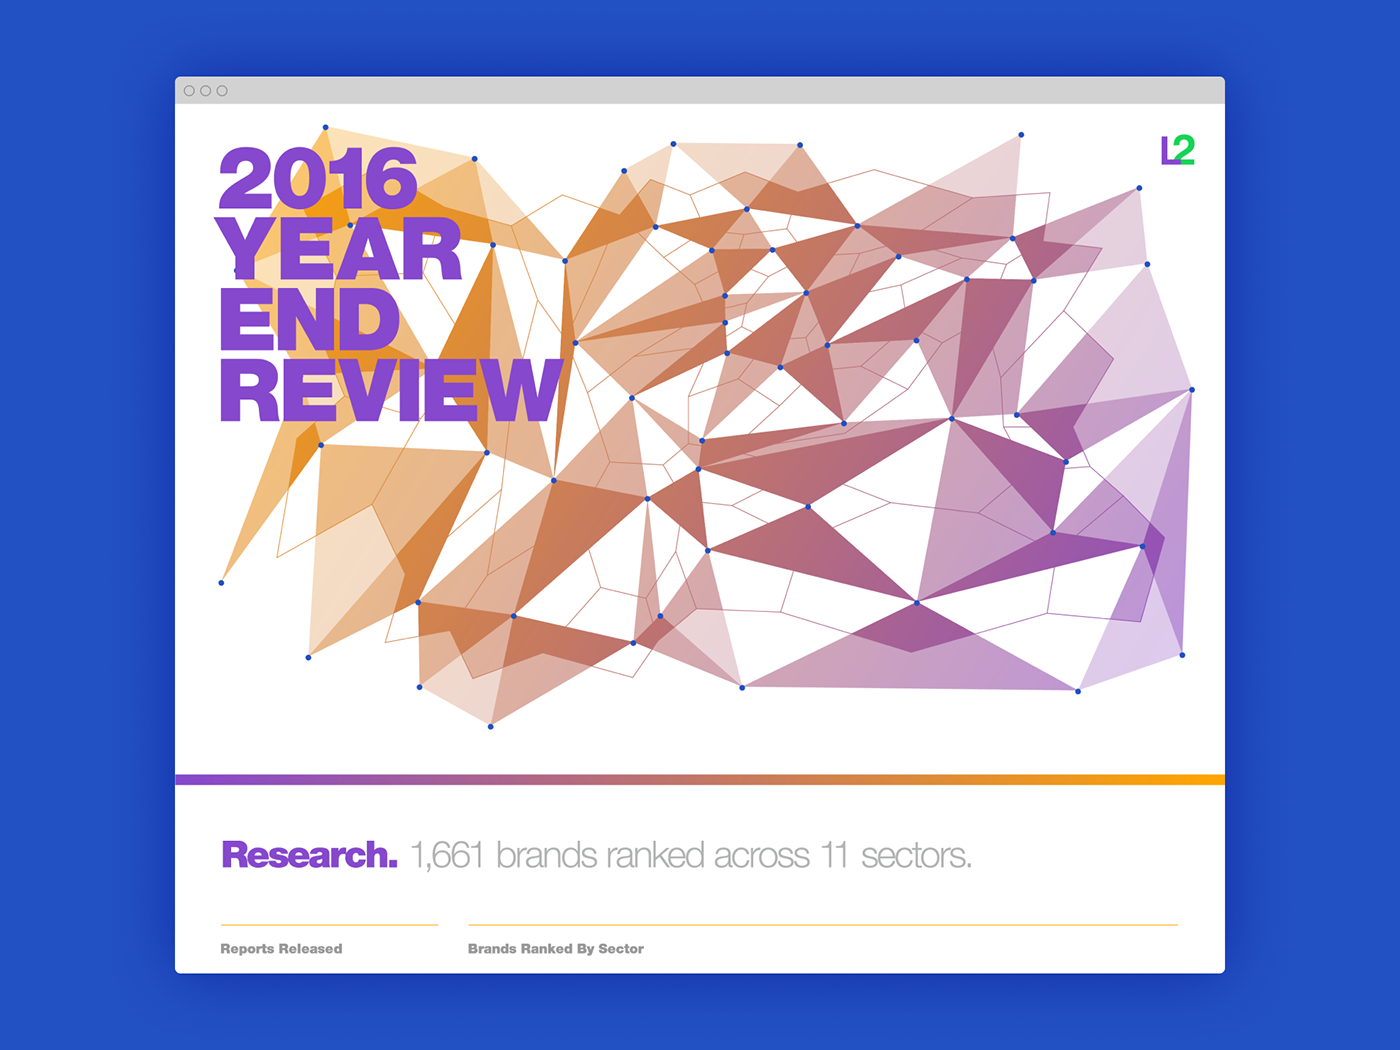
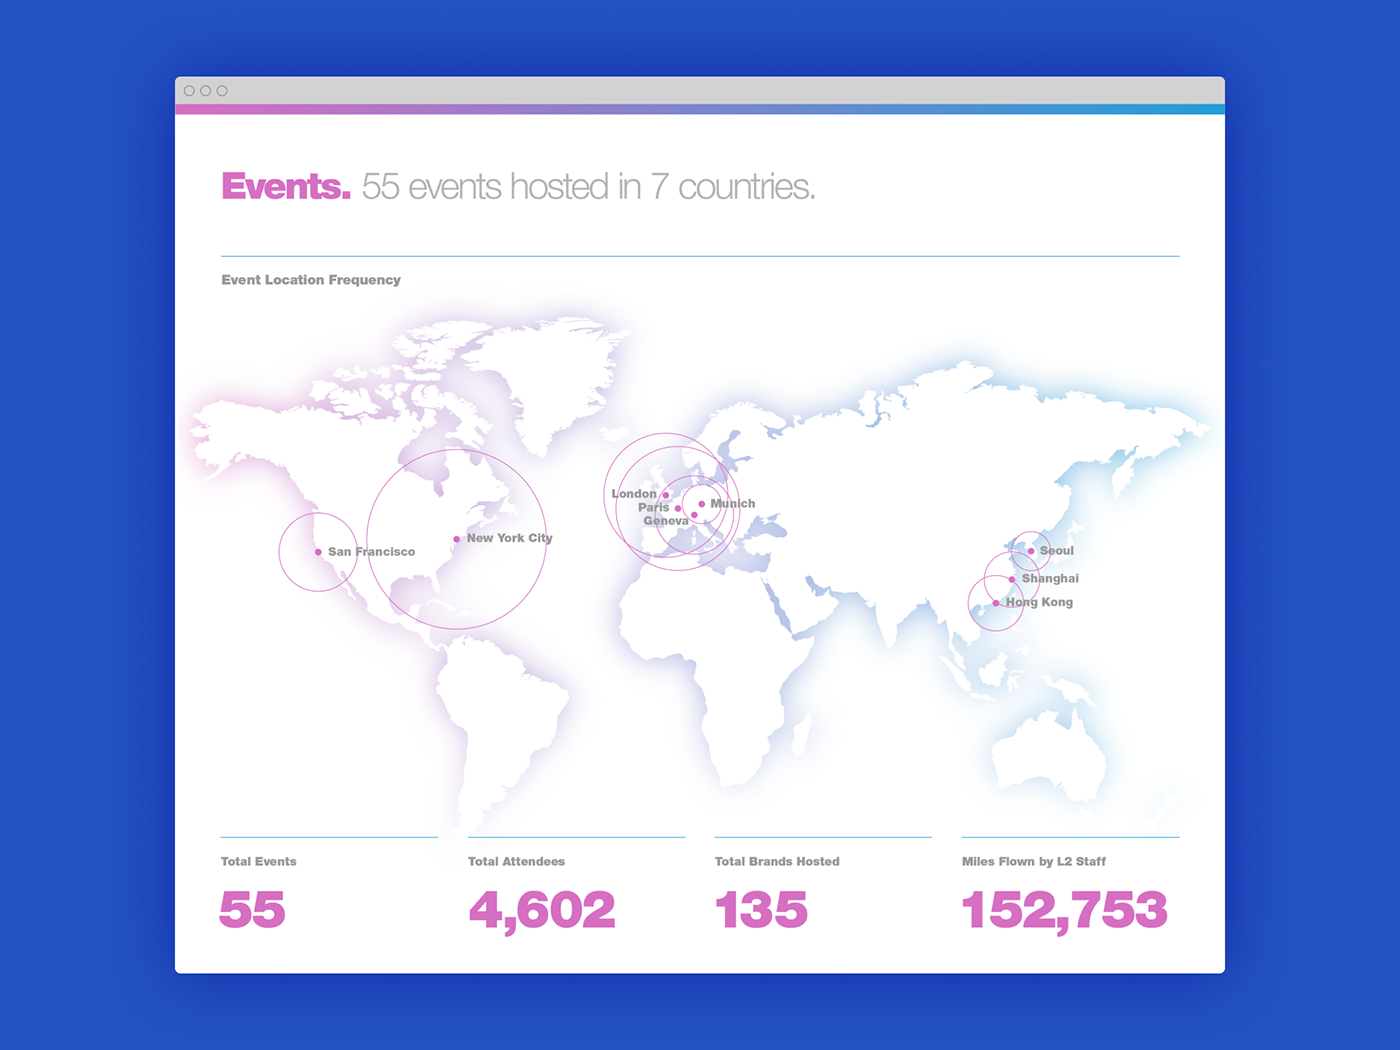
The information graphics below use data to tell a story, presenting concepts and milestones in a more memorable way. Content is divided into sections, each using its own color palette to add visual interest and help the user make assumptions about the content they're viewing.