

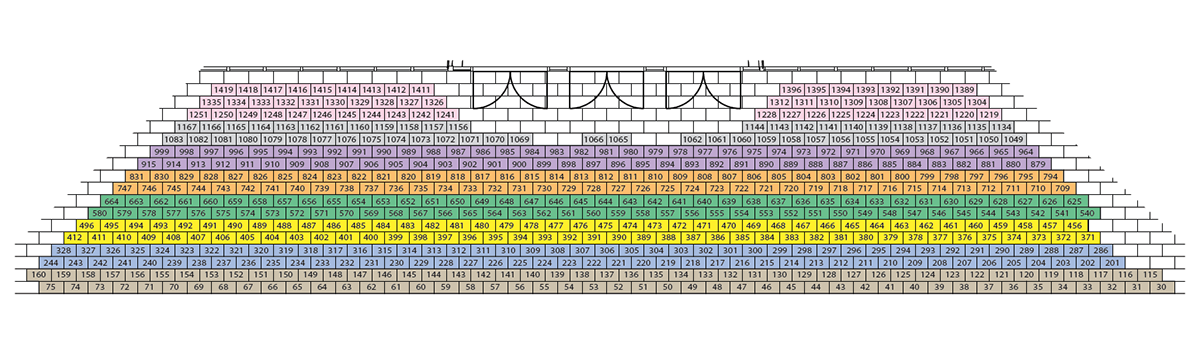
This map was develped for an opening of the Performing Arts Center. the original files were an excel spreadshhed of the donor/purchaser and the number of the stone their paver would be located. The details included walking the surface to verify the locations, color coding the sections to make the map easier to read and including the number and color next to the alphabetized list.
I utilized Illustrator to repair/use elements from the architectural rendering, I had to reverse the numbering and turn the map upside down. If you know what that takes you understand the logistics of such a feat, and I didn't just re-type each number; it was a find/replace spacing and tabbing effort for each line.
I utilized Illustrator to repair/use elements from the architectural rendering, I had to reverse the numbering and turn the map upside down. If you know what that takes you understand the logistics of such a feat, and I didn't just re-type each number; it was a find/replace spacing and tabbing effort for each line.

Architectural map of Paver Stones
The map below was built using the elements above, I developed the art in a way that would allow for future expansion of pavers to be added and coded to the same colors, what don't see is the numbers and block array off the hiden parts of the art. Its just a matter of clicking and moving a few points on the color blocks then highlighting and inverting the color on the hidden numbers.
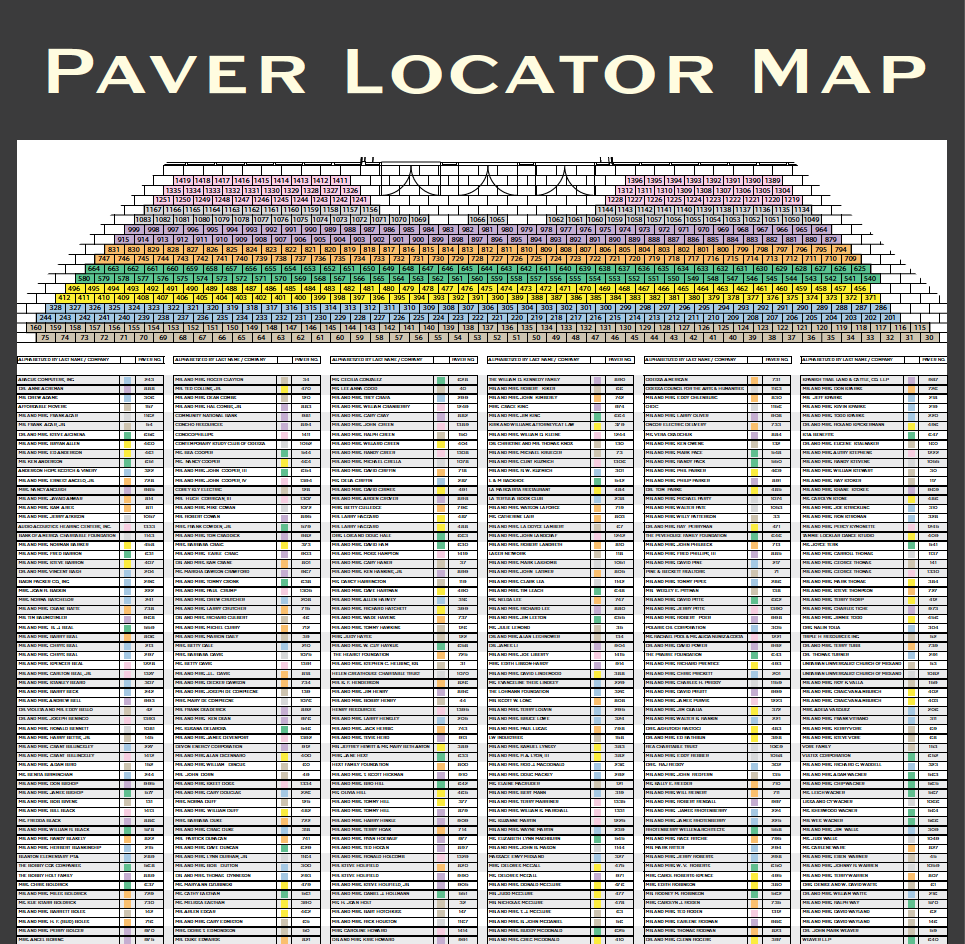
Final Map for Pull Screen
The final pull screen used InDesign to data merge from a CSV, and drop in a name, color block image and paver number onto the table to organize the map.
Pull screen crop


