Introduction
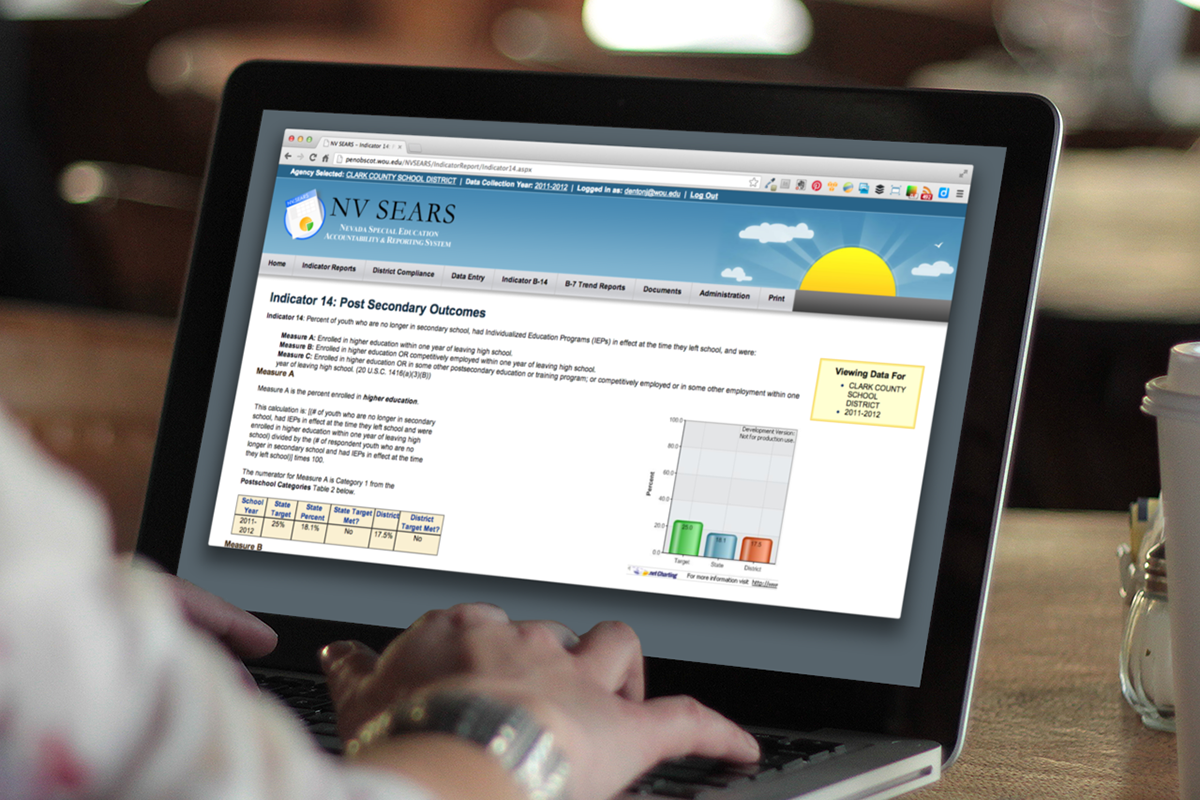
NV SEARS is the Nevada Special Education Accountability & Reporting System that TRI developed in partnership with SPEDSIS beginning in 2007. It is a web-based application for collecting and reporting special education student data against federal indicators 1 - 20. Matt O'Connor was chiefly responsible for building the application while my role involved building reports and functionality for the Transition indicator B14.
I included this project in my Scope of Work portfolio primarily because it demonstrates the breadth of my technical expertise. This project was developed using Visual Basic for .NET and Microsoft SQL Server. There were a number of new skills I needed to learn in order to do meaningful work on this project including VB.NET programming, writing SQL Server stored procedures, using the Visual Studio development environment, data analysis, the .Net Charting tool and maintaining data integrity and accuracy in reports creation.
[Screencast demonstrating the Transition B14 reports and features within NV SEARS.]
Senior Exit Reports
For indicator B14, there are two data collection instruments or surveys: the Senior Exit survey that students complete the year they leave high school and the One Year Out survey that students fill out one year after completing high school. The key data points that need to be reported from these two surveys are around higher education and competitive employment. The state and districts seek to know whether their students are engaged in higher education or are employed after high school.
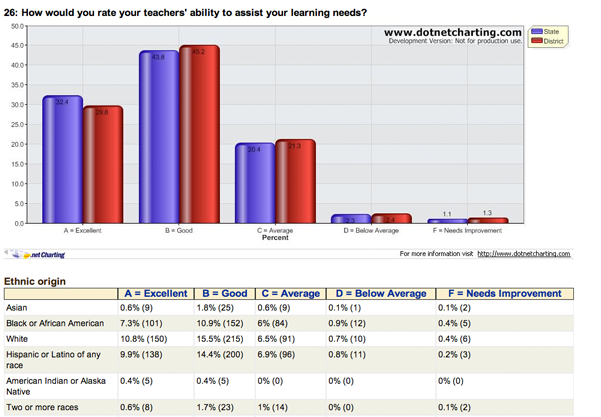
The first step in the transition data collection process is the Senior Exit survey. Once all students for the current school year complete these surveys, reports can be generated. Shown below is the interface for creating Senior Exit reports. After selecting a school year and district, a user can disaggregate data by gender, race/ethnicity or survey question. The first bar graph is always displayed and shows response data for the question, "What are your plans in the 12 months after high school?". The blue bar represents district data while the red bar shows state data.
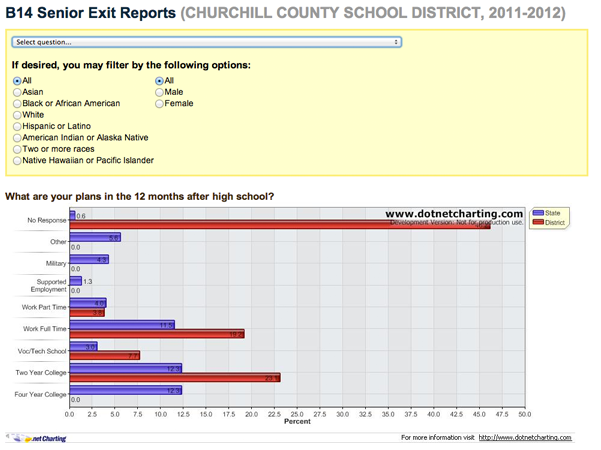
[Bar chart showing response data for the question, "What are your plans in the 12 months after high school?"]
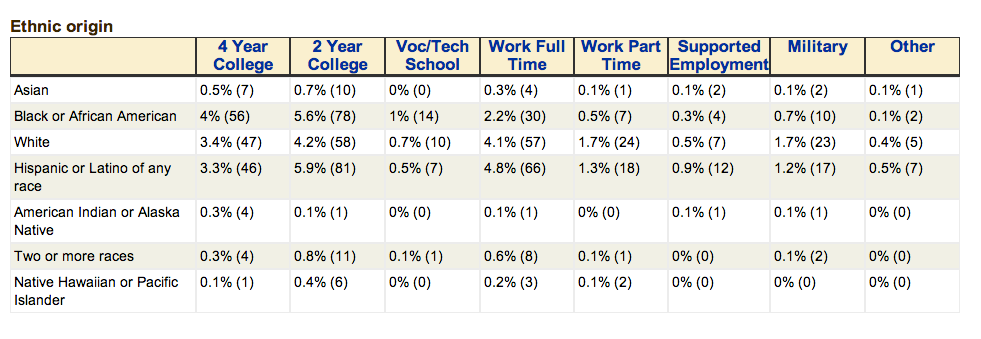
[A table below the bar chart shows the same data in tabular format.]
The second bar chart gets displayed when a user selects a specific survey question from the drop-down menu in the yellow box (shown above). Again, the data is displayed in both graphic and tabular formats.
[Second bar graph and table showing responses to survey question selected by the user.]
One Year Out Reports
Functionally, the One Year Out reports are the same as the Senior Exit Reports. The only substantial difference is in the first bar chart. For One Year Out, the first bar chart displays data for the 6 leaver APR categories: Enrolled in Higher Education, Competitively Employed, Enrolled in Other Education or Training, Other Employed, Limited Engagement and Non Engaged.
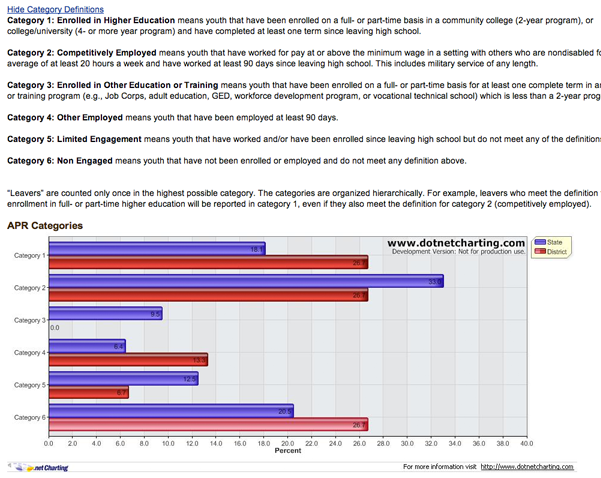
[One Year Out bar chart for 6 APR categories.]
Indicator Report
Within NV SEARS, each federal indicator has its own report and indicator 14 is no exception. I built the B14 indicator report shown in the following screenshots. The report shows, in bar chart and tabular format, data for 3 Measures (which are condensed versions of the 6 APR categories) as well as data for all 6 APR categories.
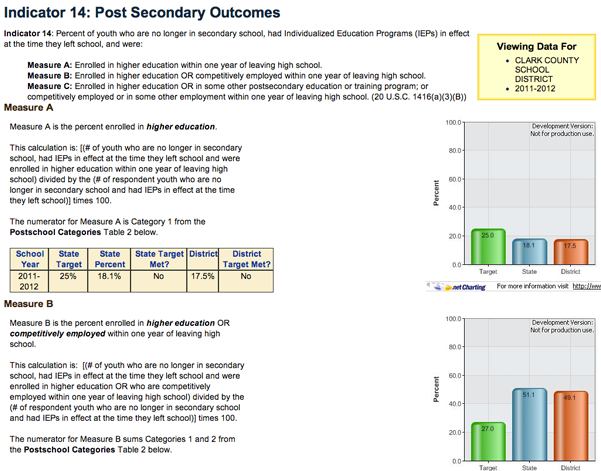
[Bar charts and tables for 3 Measures which are condensed versions of the 6 APR categories.]
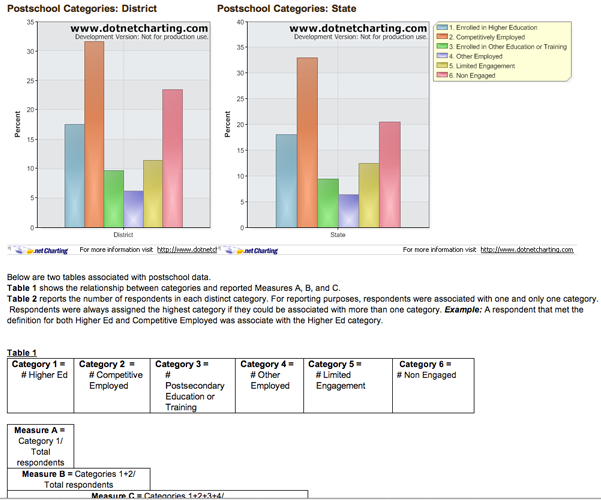
[Bar charts and tables for district and state APR category data.]
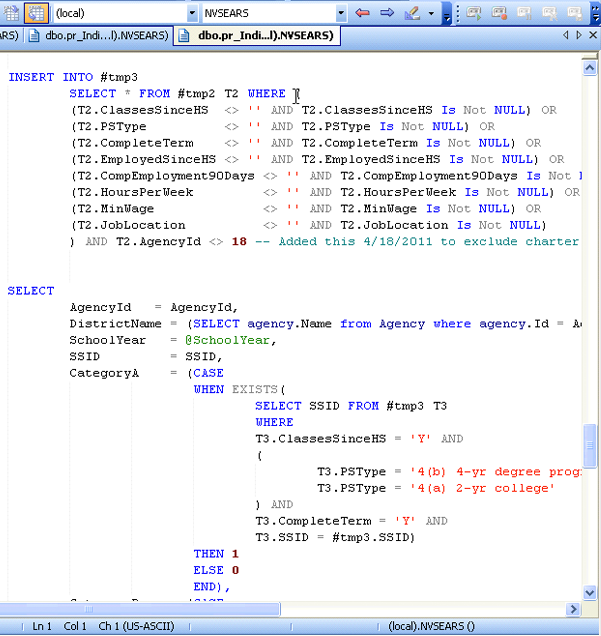
To create these reports, I needed to become familiar with SQL Server stored procedure programming. A stored procedure is a bit like a program for a database. Several SQL statements are written in a single file and executed sequentially in order to perform some larger operation against the database. The SQL code below is a small portion of the 10 stored procedures I wrote to aggregate and display report data for indicator 14.