Real-Time Dashboards to Support eSports Spectating
(this work was realised in 2017-2018)
My favourite project during my time at academia. While being funded for learning and unemployment related work by the European Commission and smaller projects, I had an itch for years to work on dataviz X video games. While we are already used to seeing statistics with sports broadcasts, video game broadcasting is still lacking, yet video games have so much more data!
We focused on one specific problem: the high paced action of different players across large battlefields is not easy to follow. So how could we help spectators get better insights in what was going on, real-time, during these hectic games played by professional gamers.
No funding is a bit of a problem, but the trick is.. students! Bless these guys, Hans Cauwenbergh and Bram Luycx, who shared our passion for games and jumped on my proposed Master thesis topic to do some pretty amazing research. While we supervised the work, guided the evaluations, helped with the analysis, and wrote the paper, Hans and Bram took on the technical challenge of creating two real-time dashboards that synchronised perfectly with live (or replay) broadcasts of League of Legends and Counter-strike: Global Offensive.
In the end, our work was published and presented at CHIPLAY, Melbourne, Australia (don't ever make me fly across the globe for a 3 day conference though ;)).
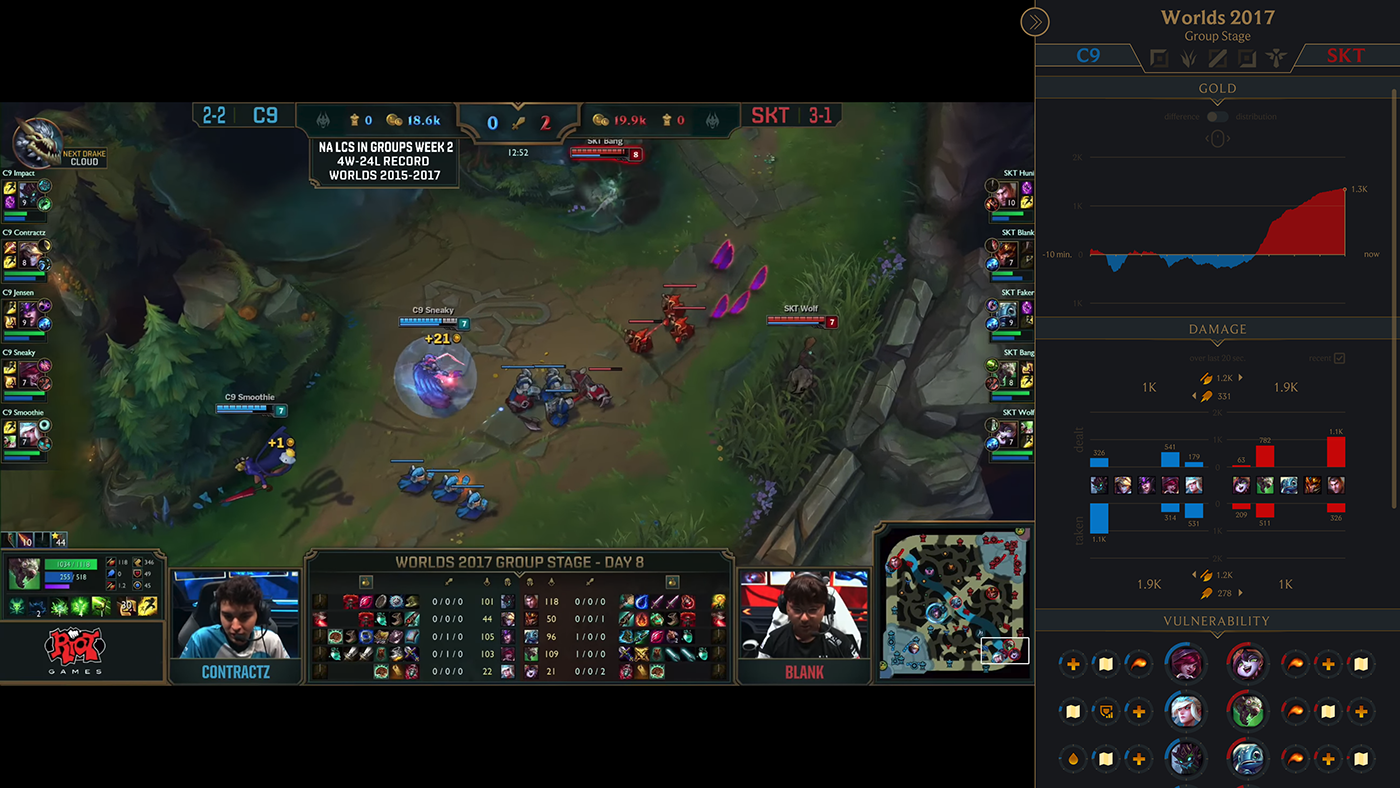
League of Legends is a complicated game. Even expert players/spectators cannot always follow the intricate details of what is going on. The dashboard (on the right) provide further insights and summarised important data. The vulnerability visualisation was an attempt to take a bunch of parameters and try to provide spectators with an idea of how vulnerable players were, taking into account their distance to their team and the enemy's, their cooldowns etc.
The path Junglers take (the player who moves across the entire battlefield, jumping out of the bushes killing unsuspecting players) is interesting from a learning perspective. Spectators enjoy watching games to improve their own skills (see below).

Our research consisted of large questionnaires completed by 100s of League of Legends and Counter-Strike players which gave us insights into why spectators watch these games, and what they'd like to see from a live dashboard. Once the first working prototypes were finished, observations, interviews, and also eye tracking gave us further insights into how the dashboards were experienced. Below you see an overview of how the attention of participants was spread across video game stream and dashboard.

Detailed LoL eye tracking analysis. The overall time spent shows in a bar chart the overall time in seconds participants spent in the areas of
interest, and the attention timeline shows the distribution of the attention of the participants during the whole match.
interest, and the attention timeline shows the distribution of the attention of the participants during the whole match.
We learned quite some lessons on what it takes to design live dashboards for video game broadcasts. There is no one-size-fits-all solution. Details can be found in our CHIPLAY publication, but I'm always happy to talk about all this in person, so give me a shout!

Learning is one of the main reasons people watch League of Legends and Counter-Strike: Global Offensive.


