Budget Visualizations
Independent Project, July 2010
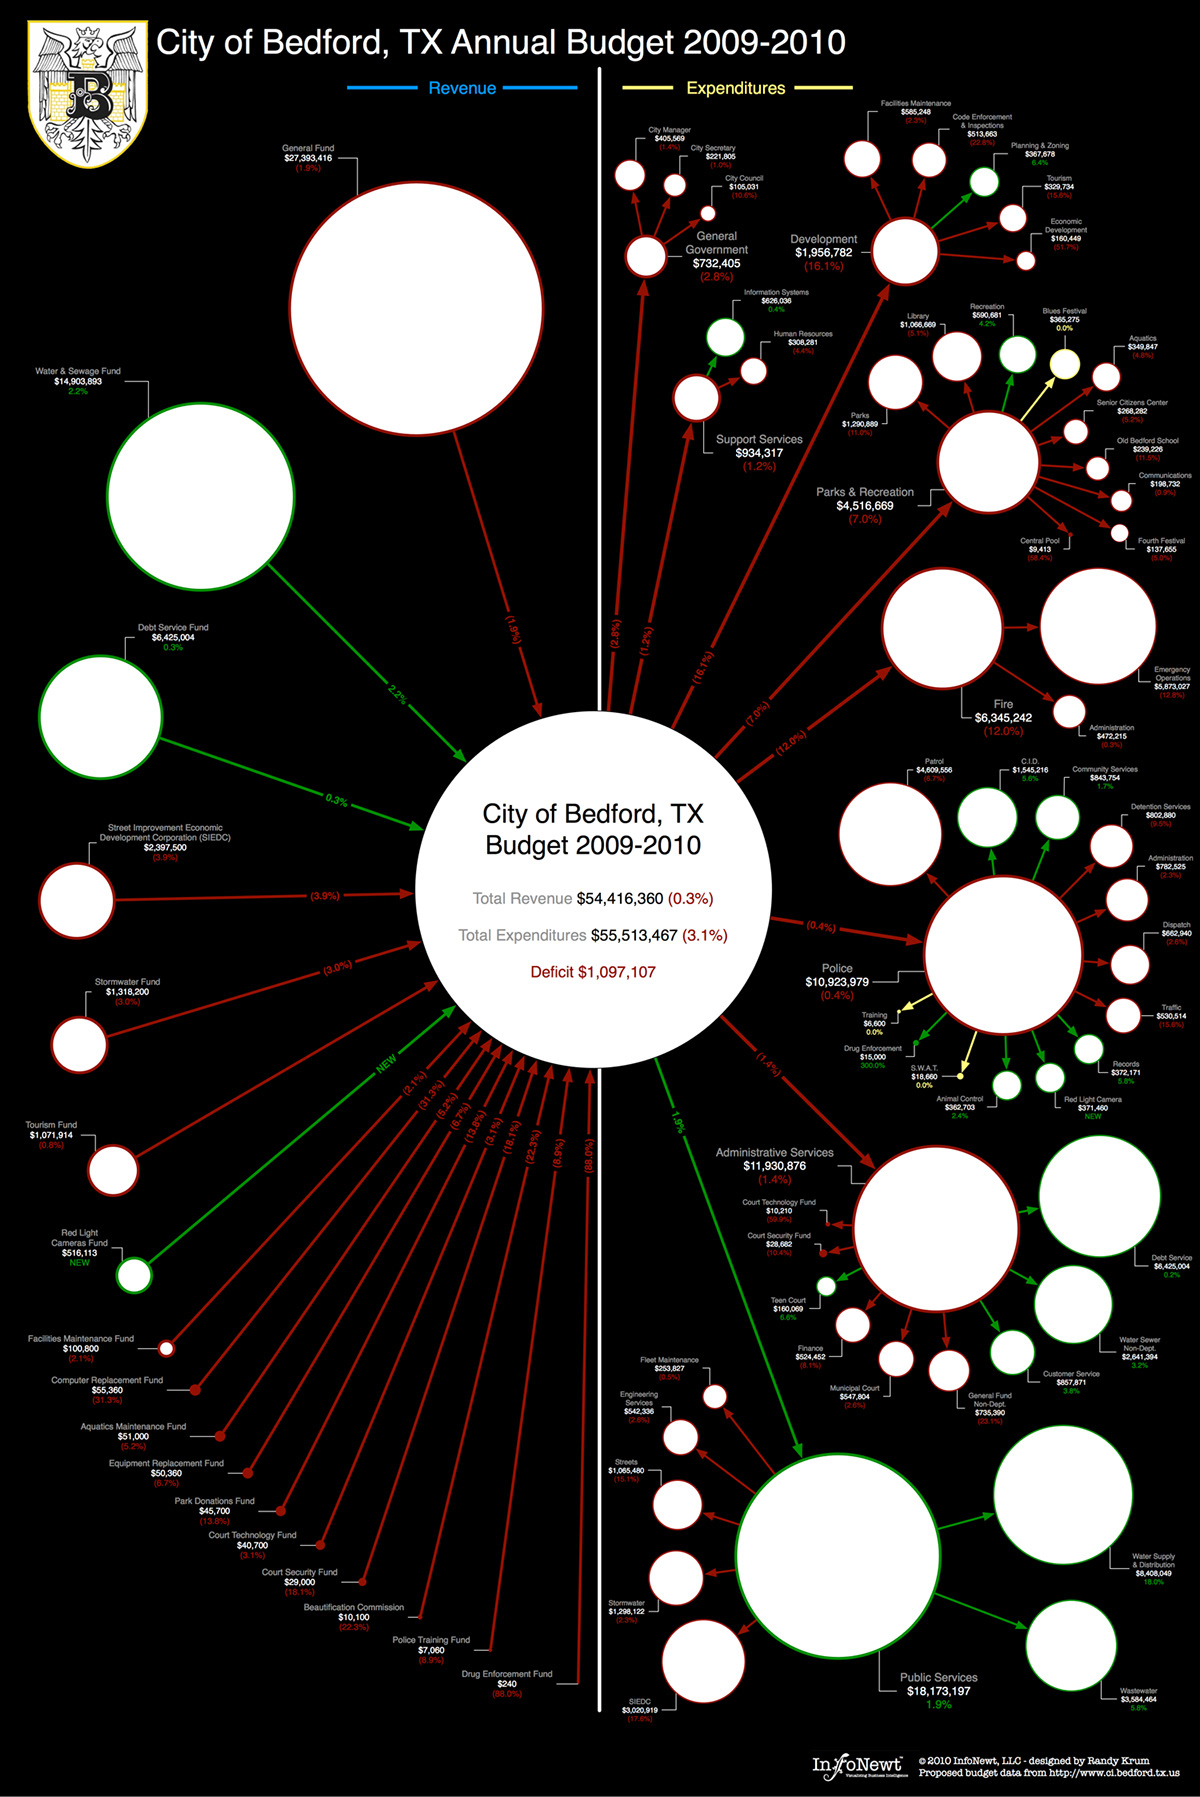
This poster serves as an example of visualizing a complete budget using proportionally sized circles. Understandably, the companies I have done this type of design for consider this their information highly confidential, which makes sharing the final designs impractical. Using a local city budget as the data source, I use this design to demonstrate what can be done with corporate data.
The left side shows all of the sources of income, and the right side details all of the expenses. The connecting line and circle border colors represent whether that line item has changed favorably (green), unfavorable (red) or has remained the same (yellow). This one-page poster is a complete summary of the original 68-page source document released by the city of Bedford, TX.
This style of visualization design can break down information about sales & profit by product lines, company departments, customers, office locations and more.