This Project was developed during the DensityDesign lab course in the final year of the Communication Design in Milan (Politecnico di Milano).
The aim of the project was to visualize and describe poverty in Italy, specifically in this poverty related to food.
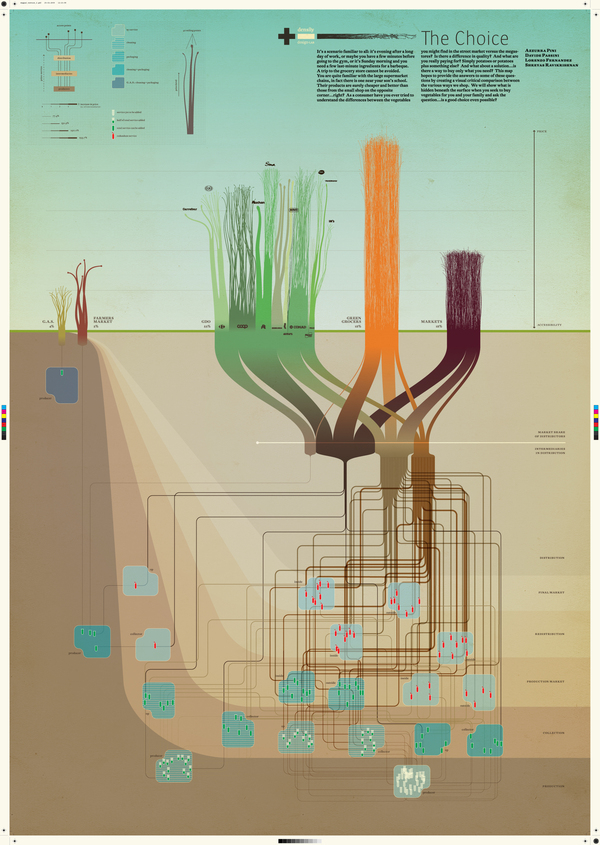
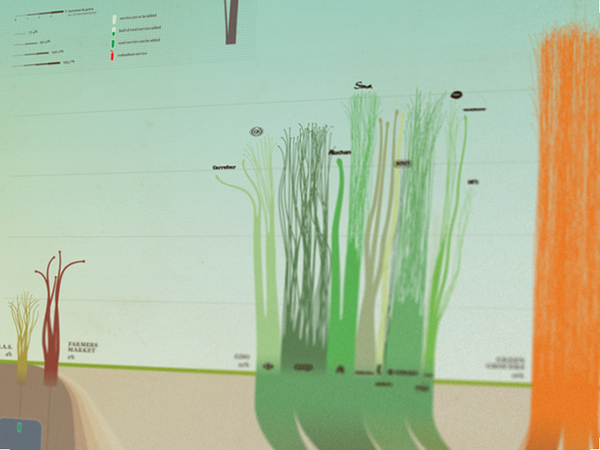
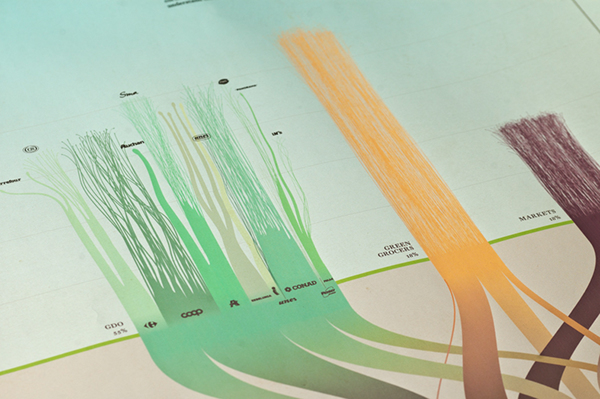
The Diagram visualize the food distribution chain from the Producers (Bottom) to the market (Top).

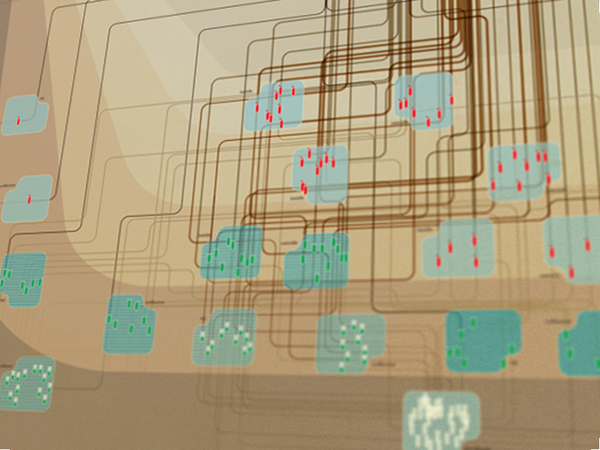
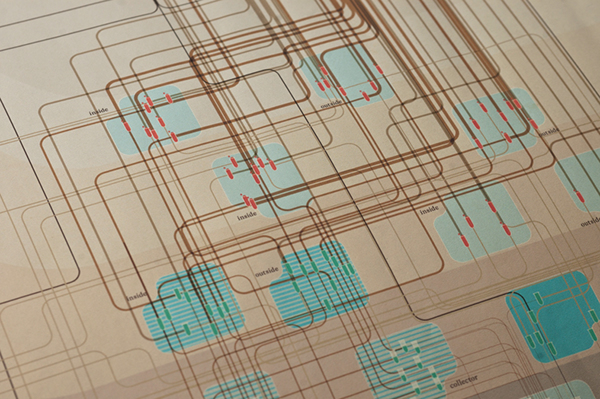
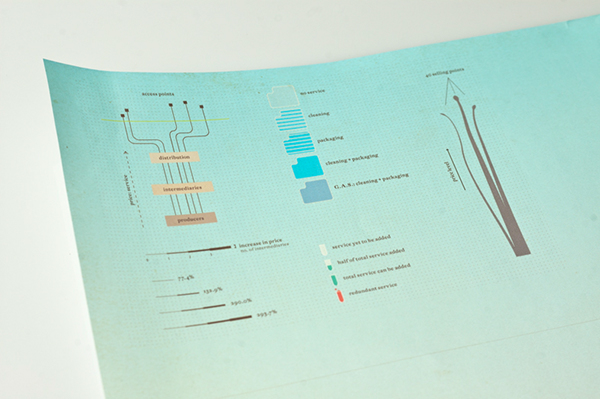
This network is a causal map of the different aspect which affect the variety of the food consumption, organized in different clusters and connected by a positive (green) or a negative (red) relationship. The map served to develop the following visualizations, as an instrument for understanding the problem.