


Generating Form from Raw Data

The goal of data S T R A N D was to understand how a designer might use numbers to create designs specific to a particular data set. Below, I used the precipitation data for New Buffalo, MI, found at www.wuunderground.com, for a four year period and then devised a way to visualize that data spatially, in three dimensions. The first image shows the data that was gathered, analyzed, and then acted upon. Each of the forms generated becomes a visual means of communicating the raw, or boring, data in a way that is more interesting and spatial. The applications of the type of design are quite numerous and there are more than a handful of artist using this methodology as the primary source of inspiration for their design work. The final output of data S T R A N D was a three dimensional model designed in Rhino 3D and then exported into Autodesk's 3DS MAX software to do the colored clay renderings. Finally, I used Adobe Photoshop to bring the images to presentation quality and give some cohesion to the project.
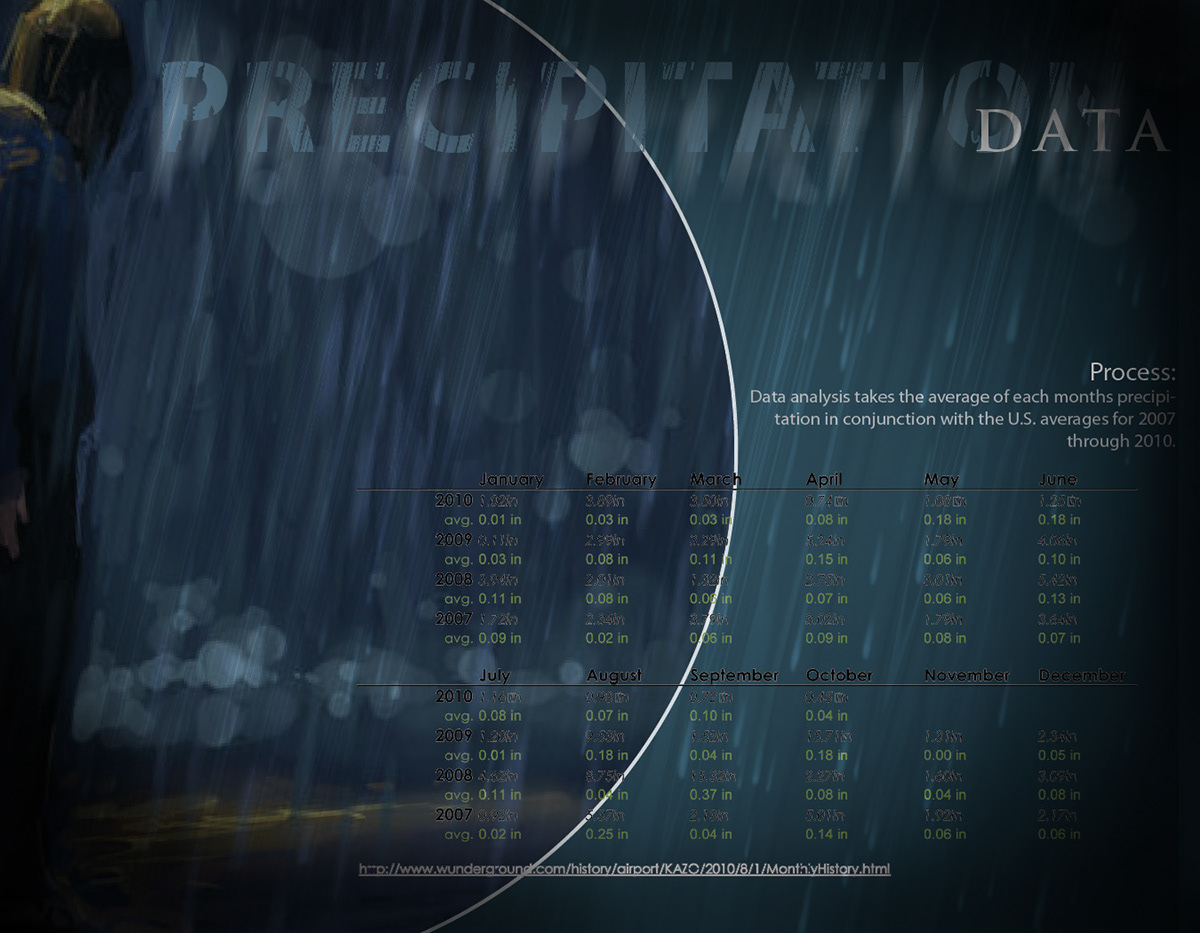
Unfortunately, the sources I checked didn't have the data in the exact format I wanted, so I used excel to layout all the yearly data with it's coresponding months.
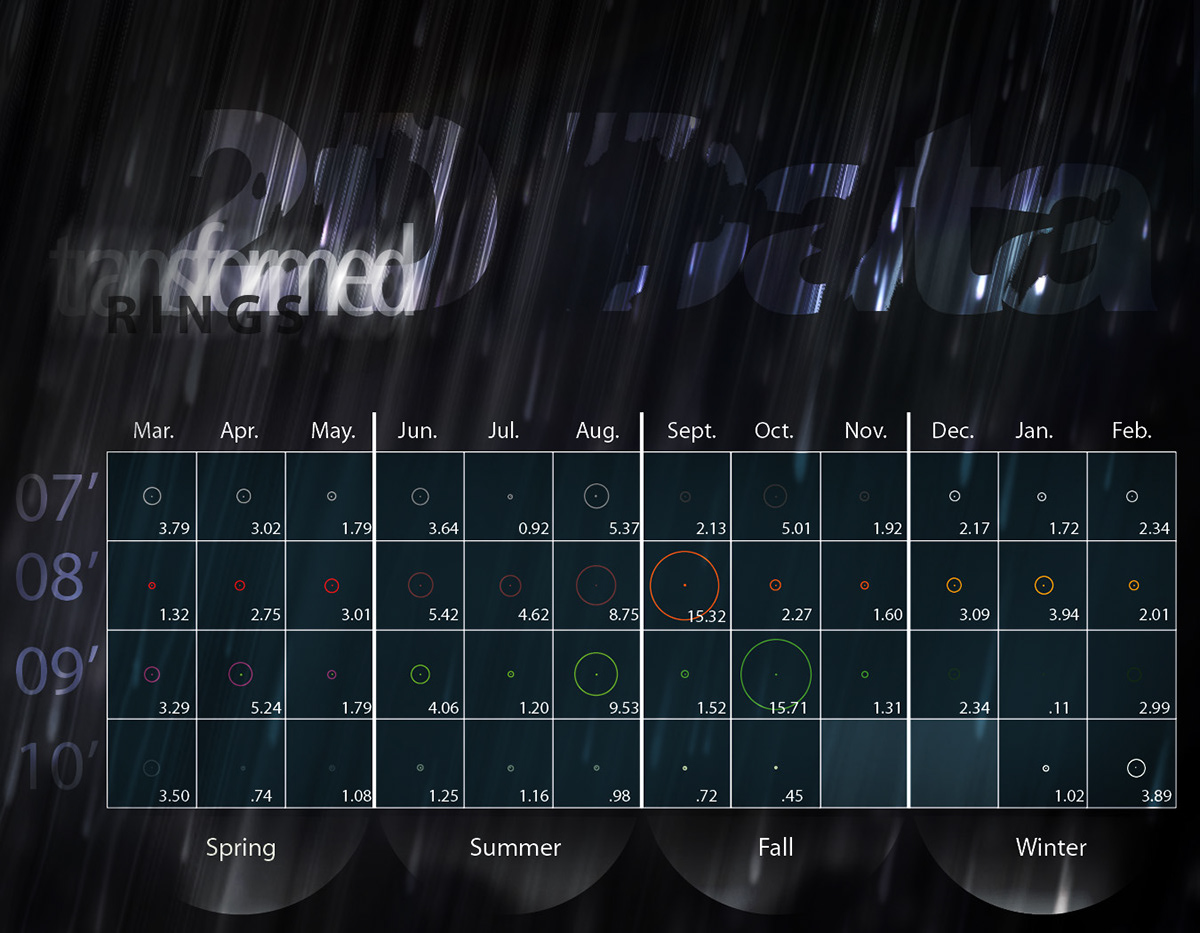
The data needed to then be translated in some way. My plan was to create a series of rings that related directly to the monthly precipitation average and then lay them out like elements on a periodic table.

The next step was to arrange the rings on a spline created in Rhino 3D, that was bent in plan according to the form of the river on the site and bend in elevation to the topography of the riverbank. Each of the periodic rings were then arranged along the spline with their center of each ring falling at a particular point along the spline.
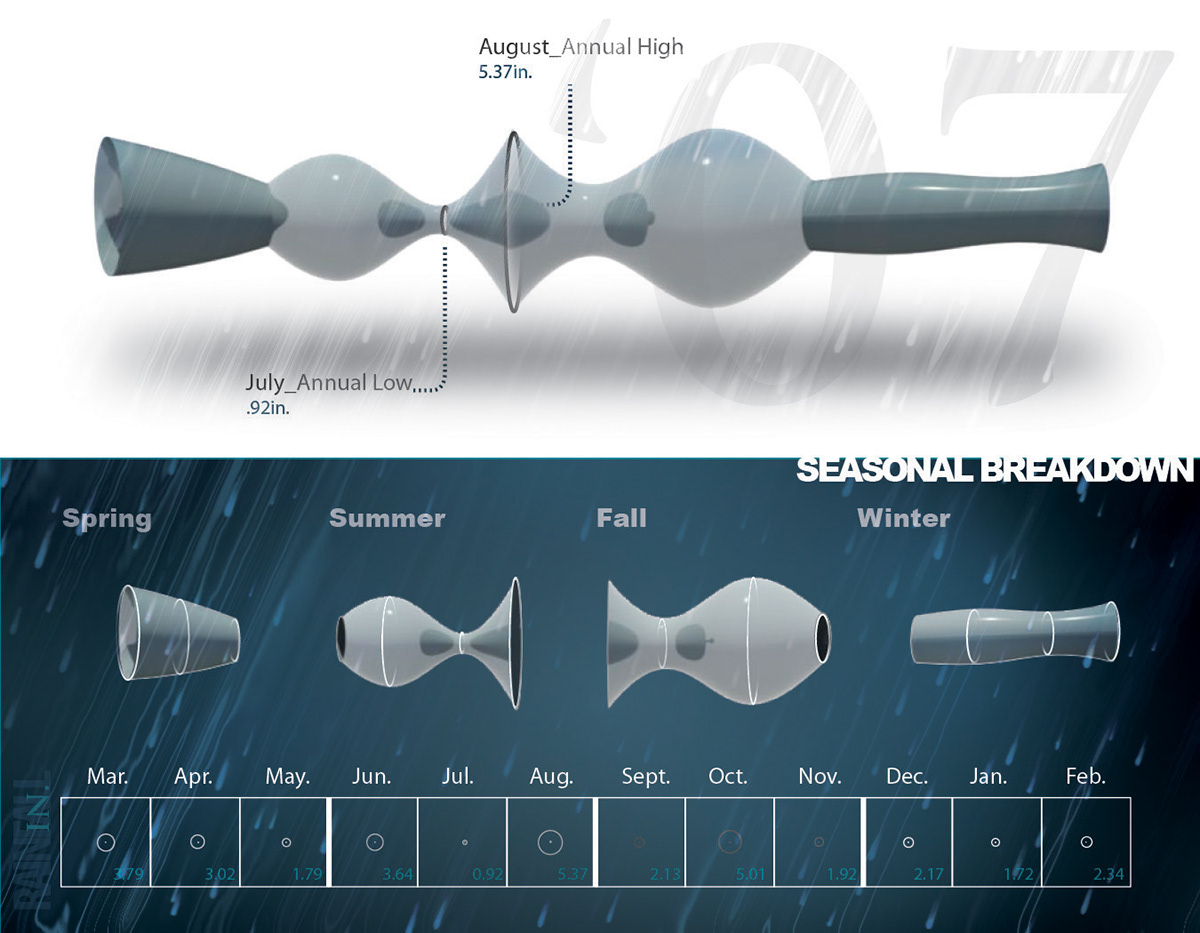
All of the rings were selected and a loft was cast across the surface of the rings creating an undulating string or pearl necklace-like form. Each of the rings was then broken back down so that we could understand how the data generated the form.


The strand above is partially incomplete because this project was done in October of 2010. Therefore, the final strand is missing a second that would correlate to the two months yet to occur.

Finally, each individual year was plugged in to the next creating a somewhat linear procession of water data over the four year period. Upon looking at the form it is clear to see two phenomenally large swells in precipitation. The first in the summer of 2008 and the second sometime in the Fall of 2009.


