


What do people do when waiting for the bus?
This question was addressed by in field research: observing the Oakville Sheridan College inter-city bus stop at 6:00pm over the span of ~6 weeks.
Close attention was paid to the locations of commuters and their interactions with their environment, others, and technology.


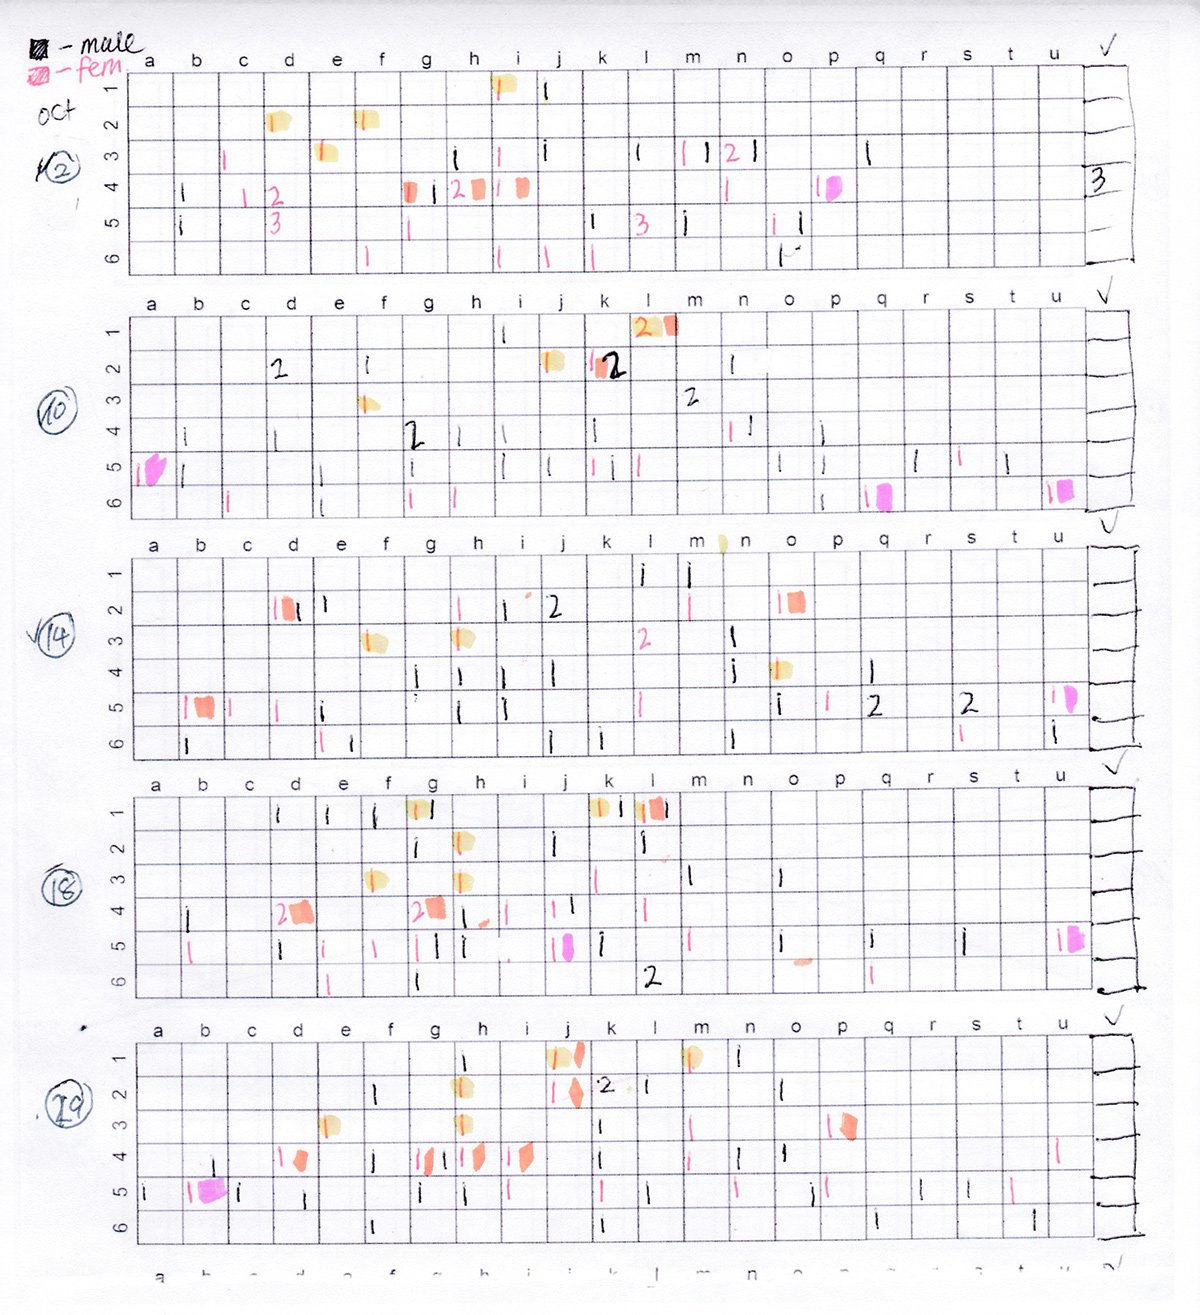
Observational map used to record observations of gender and location
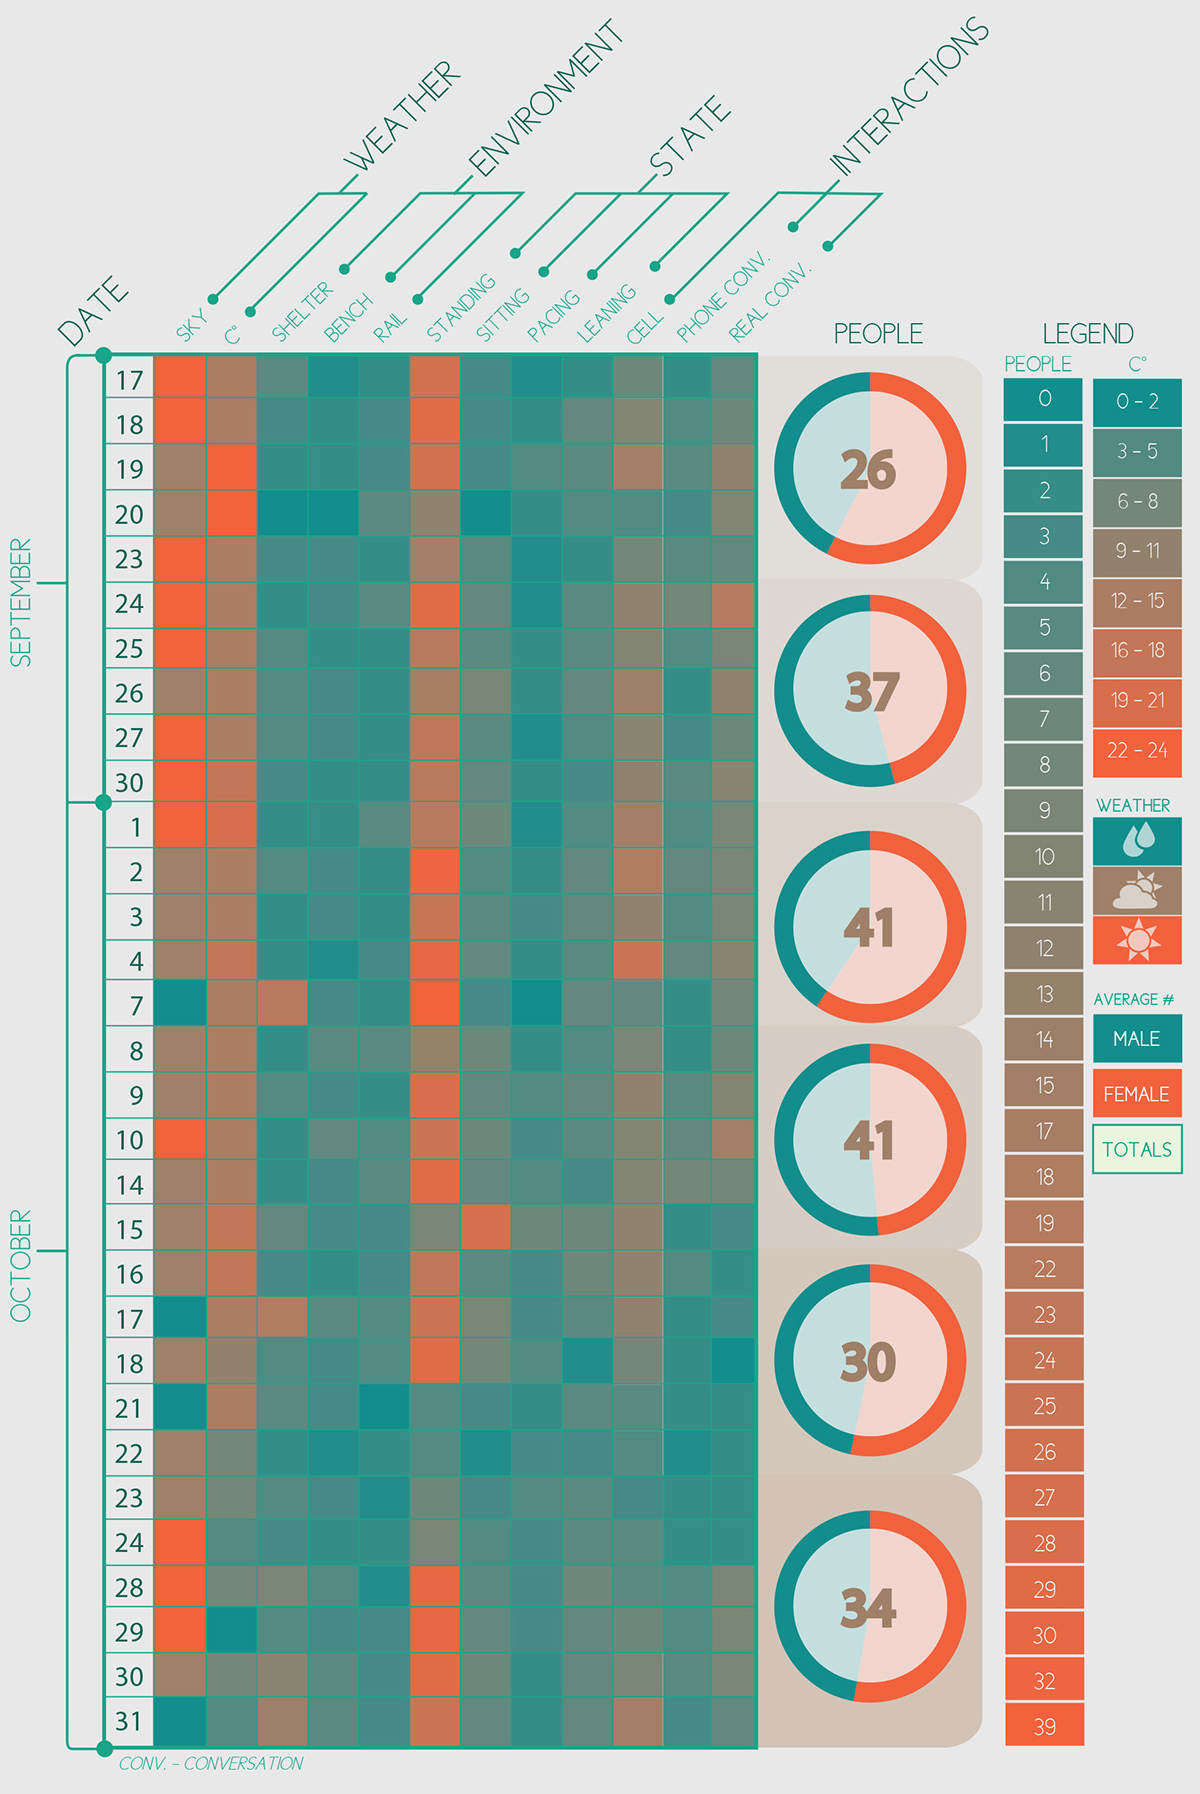
Sorting frequency in terms of a grid based location as well as activities

Information further processed in Microsoft Word and Excel

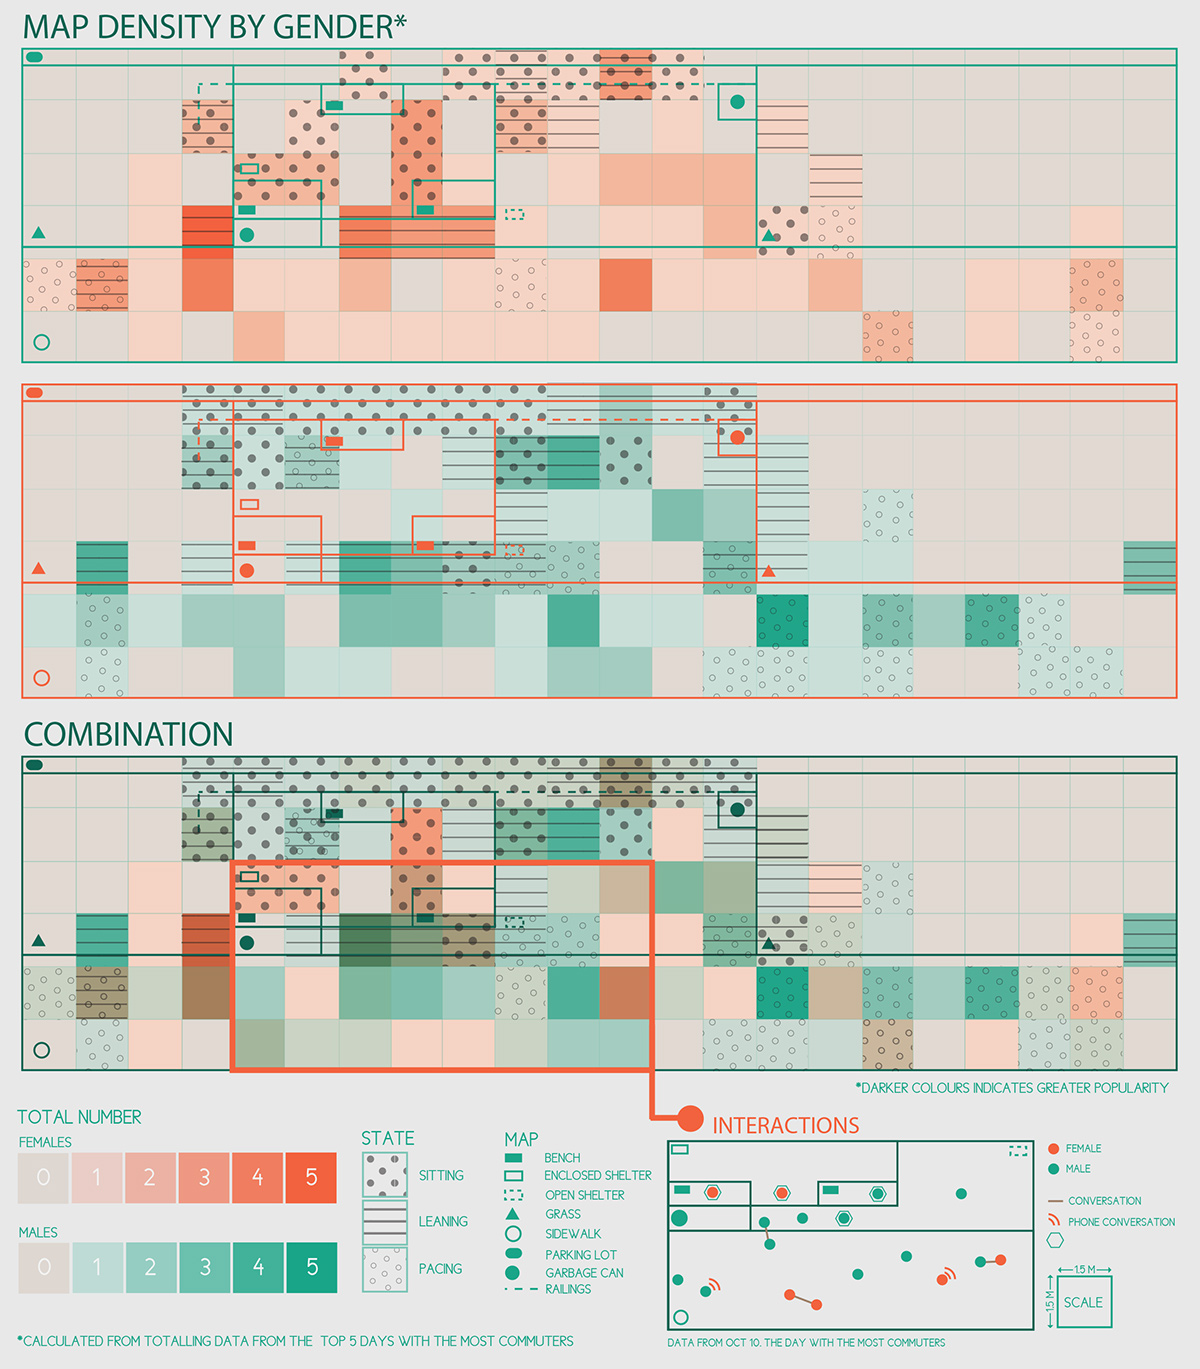
Final compilation of activities, locations, and frequency for males and females.


