

Creativity Counts
Since 2006, annual reporting data for Ontario universities has been compiled under Common University Data Ontario (CUDO) through the Council of Ontario Universities, replacing the legal need to publish conventional annual reports. As a result, printed annual reports in the Ontario university sector (when released at all) tend to be used primarily as marketing tools, and can take unusual forms.
This project presents the highlights of the most recent (2012/13) Annual Report for OCAD University (formerly the Ontario College of Art & Design), Canada's oldest and largest university-level art and design school, as a composite infographic poster. It has been published as a standalone piece, and is scheduled to be included as a removable, trifold insert in the Winter 2014 issue of SKETCH, the OCAD U alumni magazine.

The annual report infographic was designed as a two-sided 24 x 10 inch vertically-oriented poster. All type is set in one of the two official OCAD U typefaces: Gotham and Malaga.

The front side of the poster contains information on the overall composition of the student body, including undergraduate versus graduate, international versus domestic, and fine art versus design. At the right is a vertical timeline extending the entire height of the poster.
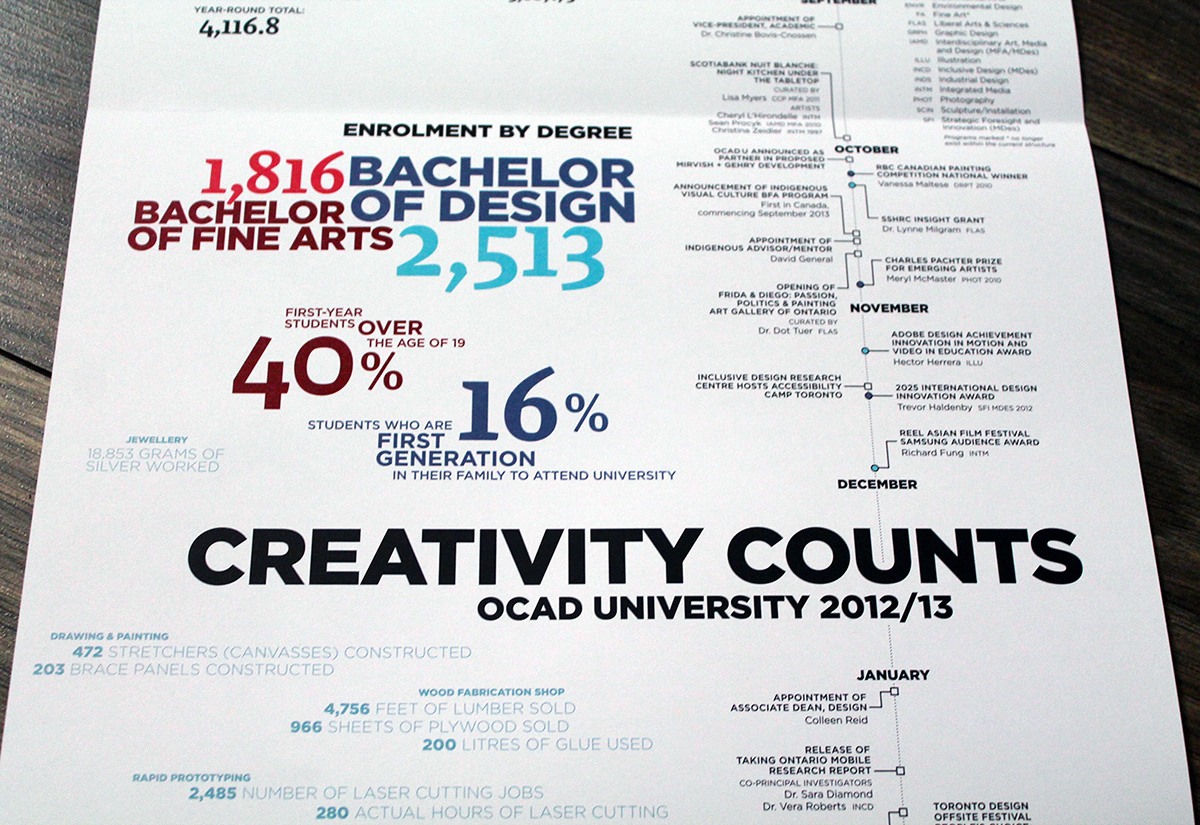
Interspersed between the infographics are "Fun Facts", mostly pertaining to the consumption of supplies and materials in the OCAD U fabrication shops and studios. This consumption is grouped by area or program.

The five largest art and design programs at OCAD U are shown in an infographic that resembles the iconic, Will Alsop-designed, OCAD U Sharp Centre for Design.

The vertical timeline, running from June 1, 2012, to May 31, 2013, lists event highlights on the left side, and award highlights on the right side. Awards are colour-coded to indicate whether the recipient is an OCAD U student, faculty/staff member, or alumnus/alumna.

The program in which the student is enrolled, faculty member teaches, or alumnus/alumna graduated (along with graduation year), is also listed beside each award recipient's name.

Timeline information is set entirely in various weights of Gotham (Bold, Medium, and Book) for visual consistency.

The reverse of the poster contains infographic depictions of OCAD U's research activities, international presence, and financial information (revenues, expenses, and development).

When stapled into the Winter 2014 issue of SKETCH, the world map will be facing forward, with the research information folded into the trifold.

The map and financial information are kept separate, as the fold between them is the location at which the folded poster will be stapled into each copy of SKETCH.
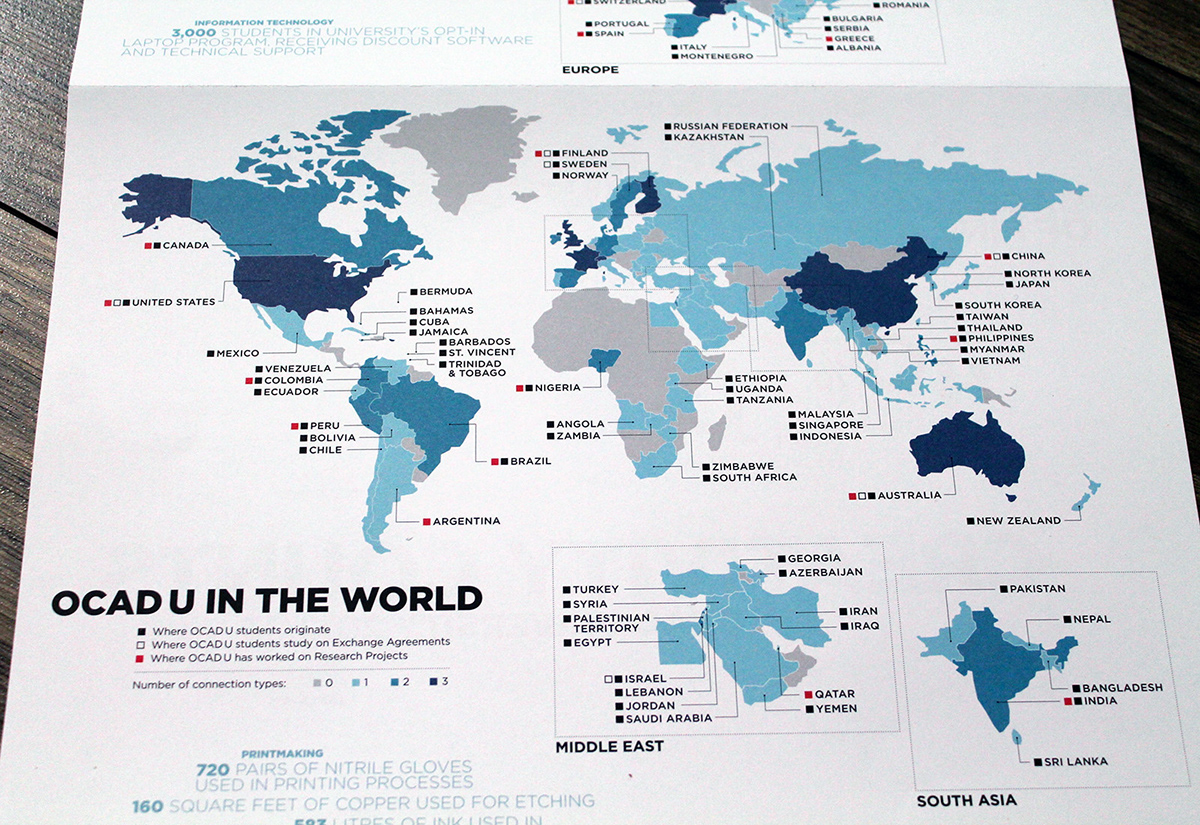
OCAD U's international presence is depicted by means of a world map, identifying countries from which OCAD U students originate, where OCAD U students have studied on exchange agreements, and where OCAD U has worked on research projects.

Particularly dense areas are clarified and expanded through the use of callout maps. The infographic has three such maps, depicting Europe, South Asia, and the Middle East.
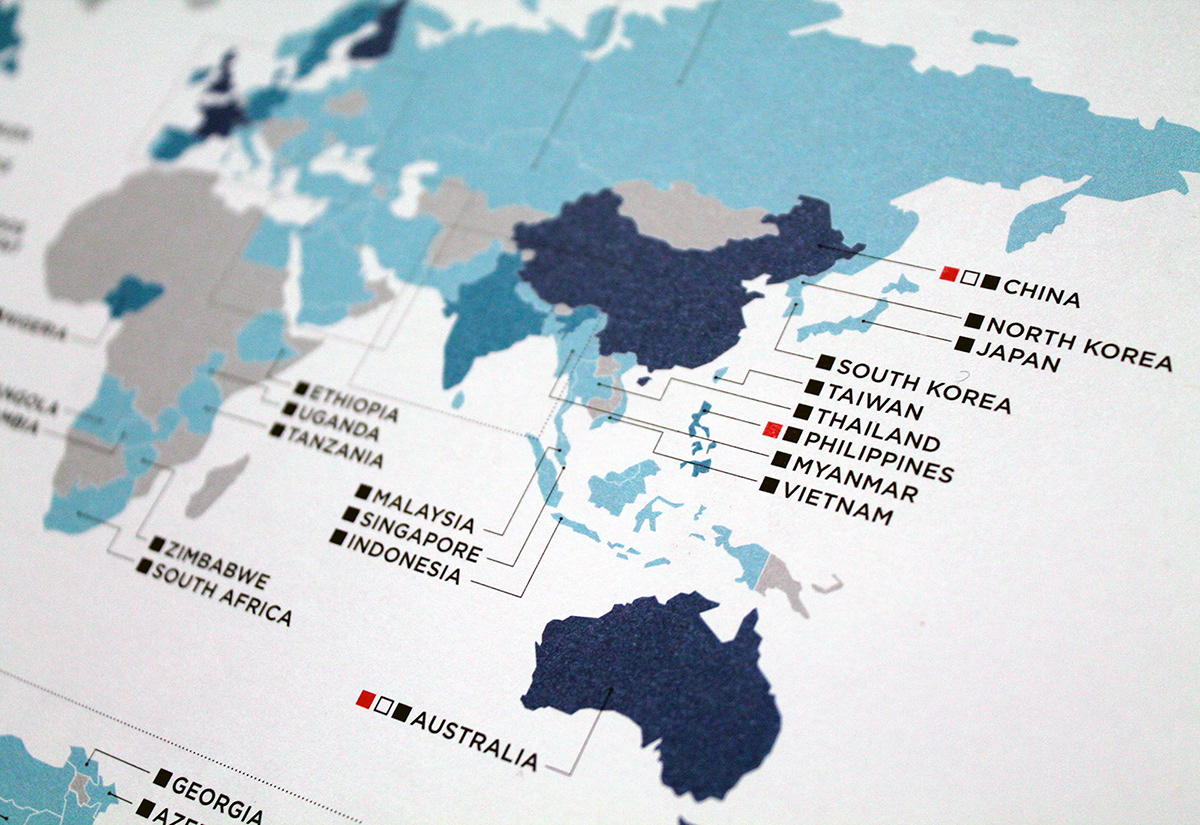
Standard choropleth map conventions depicting sequential data classes are used, with colours becoming darker as the number of connection types becomes larger.

Mapping the two types of data classes (sequential and qualitative) in an easily understandable format proved to be extremely difficult. Using separate identification systems greatly improves readability.

OCAD U's research activities are depicted in a series of infographics, including total research revenue, research revenue per full-time faculty member, and the six top sources of research revenue.

Financial information is depicted using stacked horizontal bars, breaking down total revenues by source and total expenditures by category.

Revenue sources and expenditure categories are listed in both dollar values and percentages.

Endowments and donor contributions are depicted using an two-layered annular pie chart. The "diamond ring" effect proved to be very popular with Development staff!


